Example of a BetterVIEW Panel
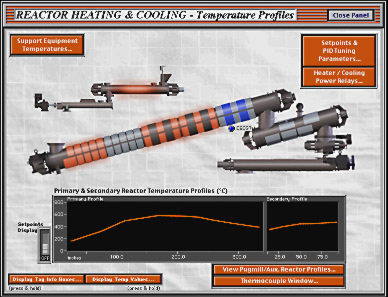
This image is an example of a subVI panel for a Temperature Control System. All critical subsystem parameters are visible from this single view. A temperature profile is displayed in the graph near the bottom of the panel, and the status of all of the "temperature zones" can be determined at a glance; when heating is on, zones display an orange glow - when cooling is active, cooling zones turn blue. Setpoints, PID tuning, numeric thermocouple readings and various other temperature system parameters are accessed via the 7 buttons distributed around the main graphical display. The detailed 3D mechanical component was modeled and rendered by TrueCAD. Compositing, layout and interface design by BetterVIEW. |